Over the coming months, we'll be rolling out some exciting new updates to ipushpull's user monitoring dashboards so we wanted to give you a quick introduction.
What are dashboards? How can they help you take advantage of ipushpull's many delivery channels for your data or service? How can they provide you with a wealth of information about your client's interests?
A better understanding of your clients
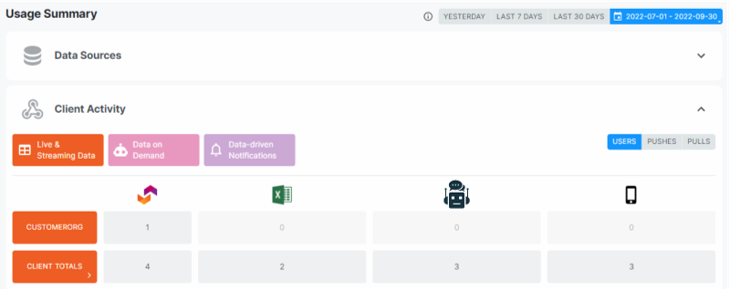
The ipushpull user monitoring dashboard allows you to see which users have interacted with your ipushpull service over a specific period and what they have been doing.
What sort of requests are your users making? Are they looking at specific data regularly? Are they using a particular application? Or perhaps via chatbots or API?
All this information will be available in your new user monitoring dashboard, giving you total transparency into what your users are most interested in, helping you to improve your service and, we hope, grow your business. You will even be able to set up notifications based on user activity so you can be ultra-responsive and not miss opportunities to reach out to your clients in the moment.
.png?width=736&name=My%20project-1%20(27).png)
Example dashboard view, showing data pull levels across channels.
One source of data, many stakeholders
Although the data available for analysis is highly granular, there is a range of different stakeholders who may use the dashboard and their requirements will be quite different. A business owner for example wants to know who is accessing the data and what are they doing with it. By contrast, a support user needs to see the granular request data to help support onboarding. In a financial use case, a head of desk or broker needs to see what their clients are requesting so that they can proactively engage with them.
You can also now clearly see which data sources you have connected to your ipushpull service and monitor their interaction and data usage in one convenient place.
Contact us to find out more about Dashboards and how this may be relevant to your use case.

.png?width=2000&name=Untitled%20(60).png)
.png?width=1200&height=628&name=Blog%20header-1%20(27).png)


.png)
.png)
